The Boston Consulting Group (BCG) Growth-Share Matrix is a strategic framework designed to help companies analyze and manage their portfolio of business units or products. Developed by BCG in the 1970s, it provides a simple yet powerful way to categorize businesses based on market growth and relative market share, guiding investment and resource allocation decisions.
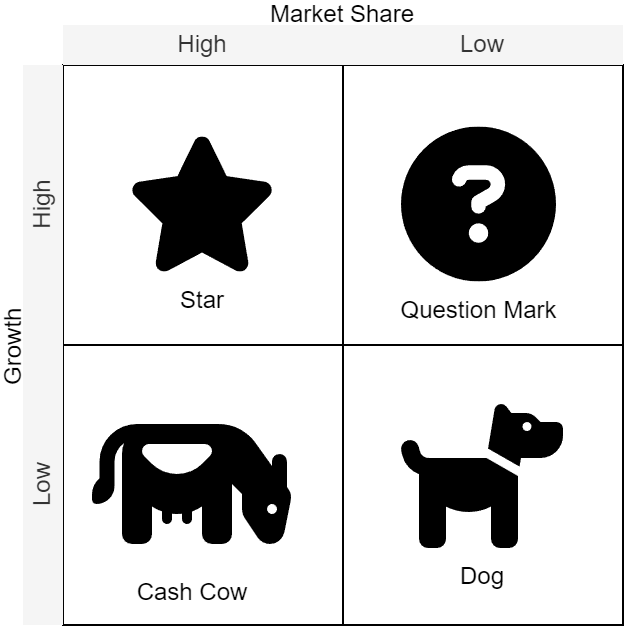
The matrix is structured into four quadrants, each representing a different type of business unit:
- Stars – High growth, high market share
- Cash Cows – Low growth, high market share
- Question Marks – High growth, low market share
- Dogs – Low growth, low market share
Through this model, firms can identify where to invest, maintain, or divest, ensuring long-term profitability and sustainability.
Components of the BCG Matrix
BCG Matrix Dimensions
The matrix is built on two key dimensions:
1. Market Growth Rate
Market growth rate measures the attractiveness of an industry and how fast it is expanding. High-growth markets indicate opportunities for expansion and increased demand, while low-growth markets suggest mature or declining industries.
2. Relative Market Share
Relative market share reflects a company’s strength within an industry, comparing its position to competitors. High market share suggests competitive advantage, possibly leading to economies of scale, while low market share indicates weakness or vulnerability.
BCG Matrix Quadrants
Each business unit is mapped into one of the four quadrants:
- Stars (High Growth, High Market Share)
- Positioned in rapidly growing industries with strong competitive advantage.
- Require significant investment but promise high returns.
- Potential to become Cash Cows as industry growth slows.
- Example: Leading AI-driven cloud services in an expanding market.
- Cash Cows (Low Growth, High Market Share)
- Operate in mature industries with stable demand.
- Generate consistent cash flow with minimal investment needs.
- Often used to fund investments in Stars and Question Marks.
- Example: A dominant soft drink brand in a stagnant market.
- Question Marks (High Growth, Low Market Share)
- Compete in promising industries but lack dominance.
- Require strategic decisions, investment for growth or divestment.
- High risk, high potential return.
- Example: A new electric vehicle startup in a growing industry.
- Dogs (Low Growth, Low Market Share)
- Operate in declining or stagnant industries.
- Often provide low profitability and drain resources.
- Businesses may be phased out or repositioned.
- Example: Traditional print newspaper in a digital world.
Theoretical Foundations and Linkages to Other Strategy Models
The BCG Matrix aligns with several established business theories:
Businesses typically progress through different life cycle stages, introduction, growth, maturity, and decline.
- Stars often belong to the growth phase.
- Cash Cows exist in the maturity phase.
- Question Marks may be new entrants in early phases.
- Dogs are typically declining businesses.
2. Porter’s Generic Strategies
Firms managing Stars and Question Marks often adopt a differentiation or cost leadership strategy to strengthen their market position.
Cash Cows may maintain cost efficiency, while Dogs often require niche focus or retrenchment.
Investment decisions in Stars and Question Marks align with market penetration or product development strategies, while Cash Cows may support diversification efforts.
By integrating insights from these frameworks, businesses can develop comprehensive portfolio strategies that optimize long-term performance.
Practical Application: How Businesses Use the BCG Matrix
Consider a multinational technology firm like Apple:
- Stars – Emerging AI-driven tools and services in high-growth markets.
- Cash Cows – iPhone and Mac product lines generating stable revenue.
- Question Marks – New wearable technology competing for market share.
- Dogs – Older, discontinued models with declining demand.
Through the BCG Matrix, Apple can prioritize investment in Stars, maintain Cash Cows for consistent revenue, strategically decide the fate of Question Marks, and phase out Dogs to optimize profitability.
Final Thoughts
For MBA professionals, the BCG Matrix provides a structured approach to portfolio management. While simplistic, it remains a valuable tool when used alongside other strategic frameworks to guide investment decisions and maintain competitive advantage.